Oct 9, 2024
Data Point, Hispanic Child and Family Facts
Latino Children Represent at Least 1 in 4 Kids Nationwide, and More Than 40 Percent in 5 States and Puerto Rico
Authors:
There were 19 million Latinoa children living in the United States in 2022, comprising 26 percent of all children in the country. In this issue of Hispanic Child and Family Facts, we use 1-year data from the 2022 American Community Survey (ACS) and Puerto Rican Community Survey (PRCS)b to provide updated estimates of the child population that is Latino in each of the 50 states, the District of Columbia, and Puerto Rico. Additionally, among each state’s population of children living in families with low incomes, we examine the population that is Latino to highlight the need for state social service programs and efforts to support Latino families’ economic well-being.
Latino share of the total child population by state, the District of Columbia, and Puerto Rico
There is a sizeable Latino child population throughout the United States, and Latino children make up 40 percent or more of all children in five Southwestern states and Puerto Rico. By contrast, Latino children represent 10 percent or less of all children in 15 states.c
- Latino children make up 99 percent of all children in Puerto Rico, 62 percent of children in New Mexico, 52 percent in California, 49 percent in Texas, 45 percent in Arizona, and 42 percent in Nevada.
- Hispanic children account for 25 to 39 percent of the child population in seven states: Colorado, Florida, Rhode Island, New Jersey, Connecticut, New York, and Illinois.
- In 23 states and the District of Columbia, Latino children account for 10 to 24 percent of the child population: Oregon, Washington, Massachusetts, Kansas, Hawaii, Nebraska, Idaho, Utah, Oklahoma, Delaware, District of Columbia, Maryland, North Carolina, Wyoming, Virginia, Georgia, Pennsylvania, Arkansas, Wisconsin, Indiana, Tennessee, Iowa, Alaska, and South Carolina.
- Latino children account for less than 10 percent of the child population in 15 states: Minnesota, Michigan, Alabama, Louisiana, Montana, South Dakota, New Hampshire, Missouri, Kentucky, North Dakota, Ohio, Mississippi, West Virginia, Maine, and Vermont.
Figure 1. In 2022, Latino children represented 40 percent or more of the total child population in 5 states and Puerto Rico
Source: Authors’ analysis of 2022 American Community Survey (ACS)/Puerto Rican Community Survey (PRCS) 1-year estimates obtained via IPUMS USA, University of Minnesota, www.ipums.org.
Latino share of the child population from families with lower incomes
Our analysis also finds that Hispanic children make up at least one quarter of the child population from families with low incomes in nearly half of all states (22) and in Puerto Rico. In contrast, as noted above, Latino children comprise at least one quarter of the overall child population in 12 states and Puerto Rico, indicating that Latino children are overrepresented in the child population with low incomes in many states.
- In nine states and Puerto Rico, Latino children make up more than 40 percent of the child population living in families with low incomes: Puerto Rico (100%), California (69%), New Mexico (67%), and Texas (64%) are highest, followed by Rhode Island, Arizona, Nevada, Colorado, Connecticut, and New Jersey.
- Latino children make up 25 to 39 percent of children in families with low incomes in 13 states: Massachusetts, Florida, Oregon, Washington, New York, Illinois, Delaware, Idaho, Utah, Kansas, Nebraska, North Carolina, and Maryland.
- In the District of Columbia and in 20 states, Hispanic children make up 10 to 24 percent of children in families with low incomes: Pennsylvania, Oklahoma, Hawaii, Georgia, Wisconsin, New Hampshire, Wyoming, Virginia, Indiana, Minnesota, Arkansas, Tennessee, District of Columbia, Iowa, Montana, South Carolina, Alabama, South Dakota, North Dakota, Michigan, and Alaska.
- Latino children make up less than 10 percent of children in families with low incomes in eight states: Ohio, Missouri, Louisiana, Kentucky, Mississippi, West Virginia, Maine, and Vermont.d
Figure 2. In 2022, Latino children represented at least 25 percent of the total child population from families with low incomes in nearly half of all states and in Puerto Rico
Source: Authors’ analysis of 2022 American Community Survey (ACS)/Puerto Rican Community Survey (PRCS) 1-year estimates obtained via IPUMS USA, University of Minnesota, www.ipums.org.
Notes: Estimates for Vermont should be interpreted with caution due to a small sample size and relative standard error above 30 percent. “Low income” is defined as family incomes below 200 percent of the federal poverty threshold.
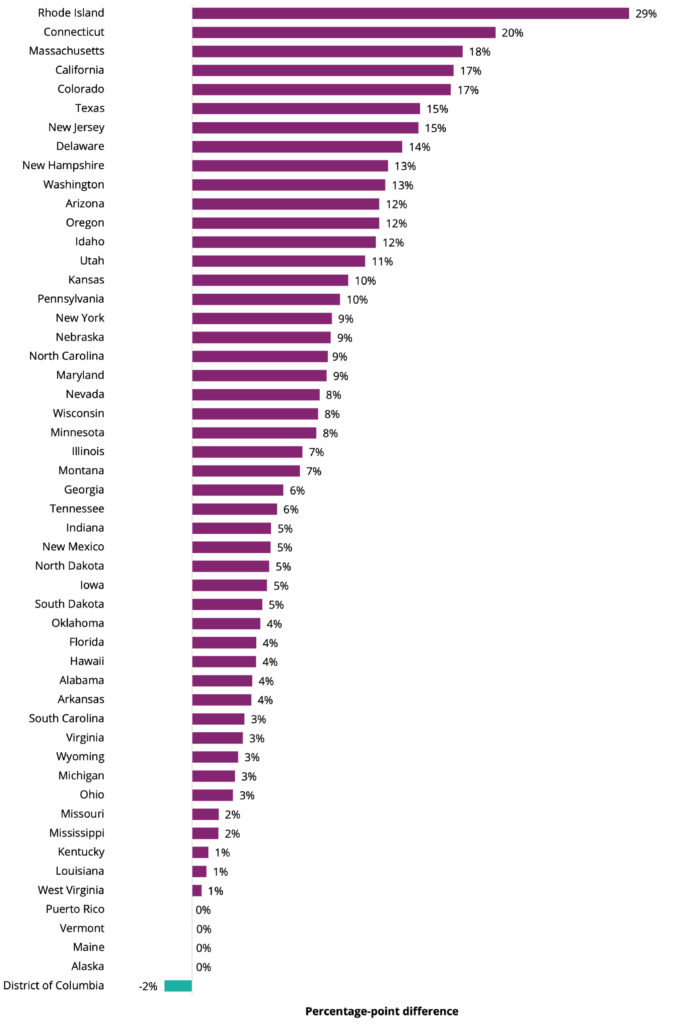
In most states, the Latino share of a state’s child population living in families with low incomes largely mirrors Latino children’s overall share of the child population, as described below (see Figure 3). However, Latino children are disproportionately represented in many states relative to their share of the states’ total child population.
Figure 3. In almost all states, the proportion of children from families with low incomes who are Latino exceeds Latino children’s proportion of the child population
Percentage-point difference between the proportion of the child population in states, the District of Columbia, and Puerto Rico that is Latino and the proportion of the child population from families with low incomes that is Latino, 2022

Source: Authors’ analysis of 2022 American Community Survey (ACS)/Puerto Rican Community Survey (PRCS) 1-year estimates obtained via IPUMS USA, University of Minnesota, www.ipums.org.
Note: Estimates for Vermont should be interpreted with caution due to a small sample size and relative standard error above 30 percent. “Low income” is defined as family incomes below 200 percent of the federal poverty threshold. Numbers above zero percent indicate that Latino children are overrepresented in the low-income population in a state, district, or territory.
In 16 states, there is at least a 10-percentage-point (pp) difference between the share of children who are Latino and the share of children from families with low incomes who are Latino. Rhode Island holds the largest gap, with a 29pp difference, followed by Connecticut (20pp) and Massachusetts (18pp). California and Colorado both hold a 17pp difference, followed by Texas and New Jersey (15pp); Delaware (14pp); New Hampshire and Washington (13pp); Arizona, Oregon, and Idaho (12pp); Utah (11pp); and Kansas and Pennsylvania (10pp).
Methods
This analysis used data from the U.S. Census Bureau’s 2022 nationally representative American Community Survey (ACS) and Puerto Rican Community Survey (PRCS) 1-year samples provided by IPUMS USA. We define Latino children as children under age 18 for whom a Latino, Hispanic, or Spanish origin was reported, regardless of race. There are 141,846 Latino children and 64,174 Latino children living in families with low incomes in the unweighted sample. Latino children living in group quarters or with missing poverty data were excluded from analyses.
We estimated percentages of all children, and those from families with low incomes, who were Latino, wherein “low income” is defined as family incomes below 200 percent of the federal poverty threshold. We created this category using the IPUMS-constructed poverty variable, which calculates each person’s family income as a percentage of their family’s poverty threshold (see this summary of the poverty measure in IPUMS).
Suggested Citation
Ramirez, L., Guzman, L., & Alvira-Hammond, M. (2024). Latino children represent at least 1 in 4 kids nationwide, and more than 40 percent in 5 states and Puerto Rico. National Research Center on Hispanic Children & Families. DOI: 10.59377/865v5358m
Appendix
Table 1. Percentage and number of all children and of children below 200% of the federal poverty level (FPL) who are Latino, by state, the District of Columbia, and Puerto Rico, 2022
 Source: Authors’ analysis of 2022 American Community Survey (ACS)/Puerto Rican Community Survey (PRCS) 1-year estimates obtained via IPUMS USA, University of Minnesota, www.ipums.org.
Note: Estimates in orange cells, marked with an asterisk, for Vermont should be interpreted with caution due to a small sample size and relative standard error above 30 percent. “Low income” is defined as family incomes below 200 percent of the federal poverty threshold.
Footnotes
a We use “Hispanic” and “Latino” interchangeably throughout this issue of Hispanic Child and Family Facts. The terms are used to reflect the U.S. Census definition to include individuals having origins in Mexico, Puerto Rico, and Cuba, as well as other “Hispanic, Latino or Spanish” origins.
b We use data from the ACS/PRCS 1-year files rather than 5-year files (2018–2022) to prevent underestimates of low income that may result from the lower poverty rates observed in 2020 and 2021 due to the pandemic tax credits, stimulus payments, and program expansions, most of which have now expired.
c All lists of states are ordered by percentage of the state’s child population that is Hispanic.
d Estimates for Vermont should be interpreted with caution due to a small sample size and relative standard error above 30 percent.


